I sail on Puget Sound. I wanted a closer look at what’s on my chart.
Shilshole Bay · NOAA ENC via CharTiles · Not for navigation
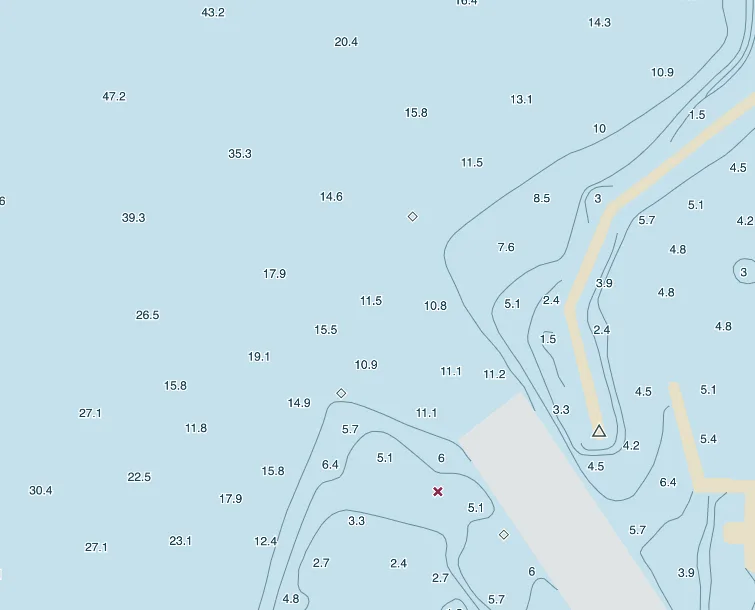
I sail on Puget Sound. Those two diamonds on the chart are entrance buoys outside Shilshole. I wanted to sit down at my laptop, click one, and see what NOAA had recorded about it.
The bigger problem
What’s the OpenStreetMap equivalent for nautical charts?
On land, I can start with a ready-made basemap. For Puget Sound, I wanted a chart layer I could inspect.
Think of the base layer underneath a street map. With OpenStreetMap, I can start with ready-made tiles, small pieces the browser loads as I move. I wanted that kind of starting point for Puget Sound, with depths, buoys, and wrecks.
What NOAA serves
You can add chart imagery. What can you click?
Configure NOAA’s image service in MapLibre. The layer gives you a picture of the chart.
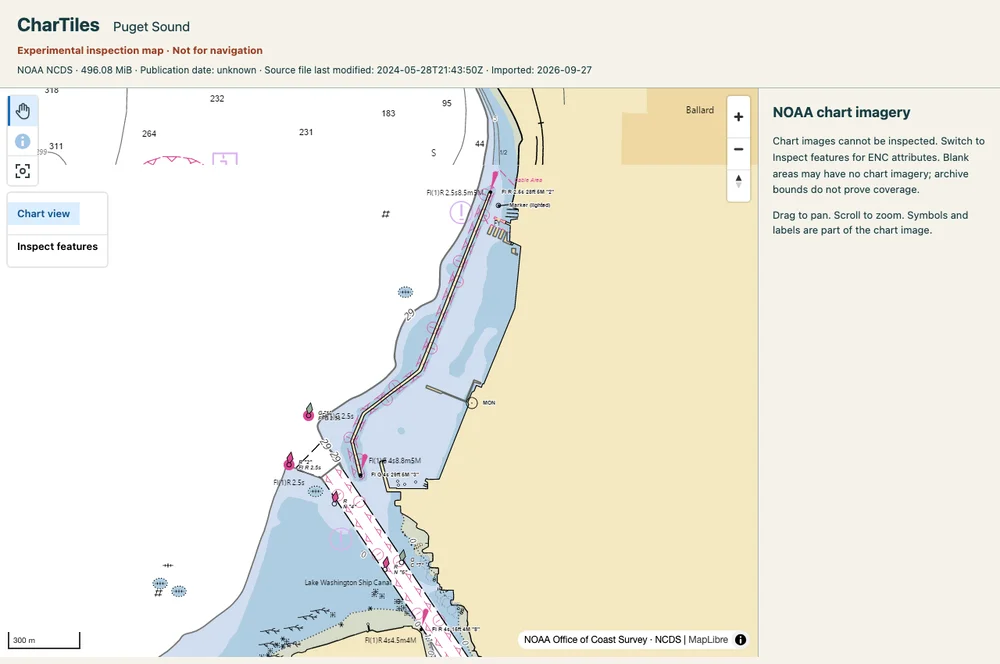
NOAA Office of Coast Survey · NCDS imagery
This screenshot shows NOAA chart imagery. MapLibre, the software drawing the web map, can display it if you tell it how to request each image. Click the wreck symbol, and the image layer has no wreck information to show you.
Shilshole Bay
What does the chart say about this wreck?
Wreck inspection · NOAA ENC via CharTiles
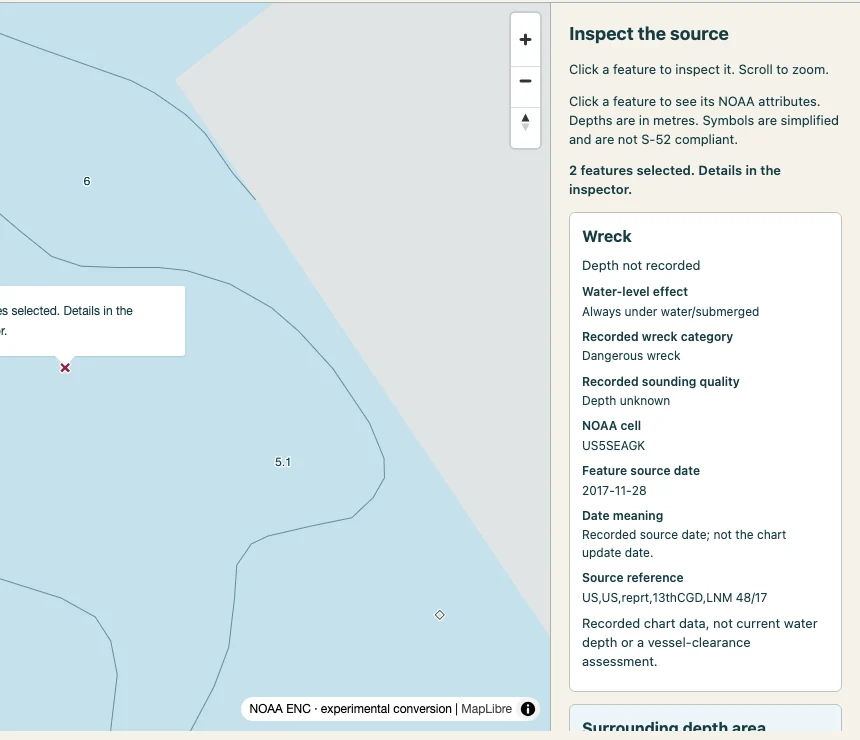
Here’s that wreck in CharTiles. The red cross marks its location. When I click it, the panel on the right shows NOAA’s description of the wreck and what’s known about the depth. The first line says “Depth not recorded.”
Two features near Shilshole
Unrecorded ≠ 0 m
Wreck
Depth not recorded
NOAA supplied no depth value.
Underwater rock
0 m
NOAA supplied a charted depth of zero metres.
Two NOAA feature records shown in CharTiles. Charted depth is separate from current water depth.
On the left, the wreck popup says “Depth not recorded.” On the right, the nearby rock has a charted depth of zero metres. If I fill the wreck’s blank with zero, the two would look alike, and I’d be telling you something NOAA never reported.
Back to the Shilshole wreck
Which chart says “depth not recorded”?
The wreck’s detail panel lists NOAA chart US5SEAGK.
The same wreck and its source chart · NOAA ENC via CharTiles
We’re back at the wreck panel. Below “Depth not recorded,” look for the line labeled “NOAA cell.” A cell is one chart’s geographic area. That code identifies the source chart I’d open to check the wreck myself.
Why convert the files?
From a NOAA chart to the tiles you see.
NOAA chart file
→
Features grouped into tiles
→
Tiles the browser loads
The outlined tiles cover the browser’s current view. · Schematic example
On the left, NOAA’s chart file stores the coastline and buoys in a format called S-57. In the middle, CharTiles groups those features into tiles. On the right, the outline shows which tiles the browser needs for the area you’re looking at.
Hosting nautical charts
Why PMTiles for a web map?
MBTiles
BrowserAsks for a tile →Tile serverLooks up the tile →MBTiles file
PMTiles
BrowserAsks for a byte range →Hosted PMTiles file
Simpler hosting. No dedicated tile server and no full archive download.
Top row: the browser asks a tile server, which looks up the tile in MBTiles. Bottom row: the browser asks static hosting for a slice of the PMTiles file. Both can send only what’s needed. The win is one file to host and no tile server to run.
The first regional build
A piece of coastline disappeared during web tiling.
The NOAA source chart had a short coastline segment near Shilshole. When we built the web tiles for Puget Sound, it disappeared. The map still looked fine. We caught it by comparing the features in the NOAA files with the features in the tiles.
Rounding on the web tile’s coordinate grid
Two endpoints snapped to one point.
Source endpoints
AB
→
Coarse web tile grid
A + B
Both endpoints round to one point. The line disappears. · Schematic, not to scale
On the left are the two ends of that tiny coastline segment. On the right is the web tile’s own coordinate grid. When we wrote the line into the tile, both ends rounded to the same spot. The line disappeared inside the tile.
A finer web tile grid
Separate points. The line survives.
Source endpoints
AB
→
Finer web tile grid
AB
Separate grid points keep the line. · Schematic, not to scale
Same endpoints on the left. On the right, the grid has more positions to choose from. Each end now rounds to a different point, so the tile can keep the line. The grid got finer. The original survey stayed the same.
What the build checked
Same feature ID. Same depth.
Before tiling · Extracted from NOAA
Feature ID…0226BAD3CD1A9C11…
Sounding depth226.4 m
→
After tiling · Read back at zoom 16
Feature ID…0226BAD3CD1A9C11…
Sounding depth226.4 m
One Shilshole sounding. The slide shortens the ID. The test compares the full ID.
Still to check · Exact shapes, joins at chart edges, and how the map looks at other zooms.
This Shilshole sounding is a charted depth measurement. Compare the left and right: the same feature ID and 226.4 metres. We ran that check at the most detailed source tile zoom. It doesn’t tell us whether shapes changed, chart edges join, or the map looks right zoomed out.
Publishing an update
Keep the map working during an update.
1. Upload the new archive
Web mapRelease pointer →
Old archiveNew archive Uploading…
2. Switch the pointer
Web mapRelease pointer →
Old archiveNew archive Ready
The release manifest is the file that tells the web map which archive to load.
On the left, the arrow still points to the old archive while the new file uploads. On the right, the new file is ready, so we switch the arrow. If we switched it too early, the browser could ask for tiles that aren’t there yet.
Coverage audit
Draw the footprints.
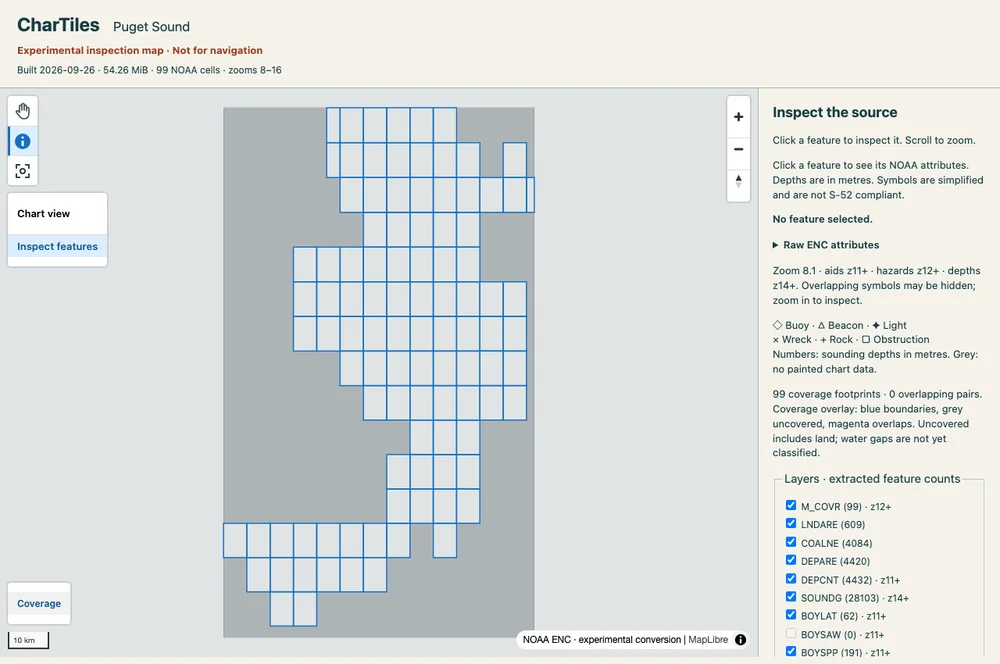
99 chart footprints. No two covered the same area in this build.
Chart coverage outlines · NOAA ENC via CharTiles
On the map, each blue outline traces the area one NOAA chart says it covers. That area is its footprint. In this build, none of the 99 footprints shared any area. Two charts can still touch along an edge.
A separate example · Source-chart edges
The source charts meet. The coastline doesn’t.
Coverage check · the edges meet
Chart AChart B
Feature check · the coastline breaks
Chart AChart B
Schematic · Two source charts share an edge. Their coastline endpoints don’t line up, even before web tiling.
This is a separate example, before we make any web tiles. On the left, two source charts share an edge. On the right, the dots show where each chart’s coastline reaches that edge. The coverage lines up. The coastline doesn’t.
Chart scale and browser zoom
Zooming in can’t add chart detail.
Coastal chart
→
Same chart, zoomed in
→
Harbor chart, same zoom
4.28.7
The extra buoy, depths, and dock come from switching charts. · Schematic example
On the left is a coastal chart. In the middle, zooming in makes the same marks larger. On the right, I switch to a harbor chart at that same zoom. The extra buoy, depth numbers, and dock come from the more detailed source.
Overlapping chart cells
Two charts show the same buoy.
Harbor chart
Coastal chart
The dashed lines show the two charts’ coverage. The buoy falls inside both. · Schematic example
These panels show the same harbor entrance. The dashed box on the left is the harbor chart’s coverage. The bigger box on the right is the coastal chart’s. That diamond is the same buoy in both files. Which one should the web map use?
A test for the next build
One buoy on the web map.
Web map at harbor scale
Buoy details
Source chartHarbor chart
Expected result for this example. One symbol at the buoy’s location, with its source visible on click.
At harbor scale, this example uses the harbor chart. On the left, there’s one diamond where the buoy belongs. On the right, the detail panel tells me which chart supplied it. That gives us three things to test: one symbol, right place, right source.
The whole pipeline
Every stage has a check.
Ingest99 NOAA chart filesCheck: every feature keeps its source chart
ExtractFeatures and attributesCheck: unrecorded stays unrecorded
TileOne 54 MiB PMTiles fileCheck: IDs and depths read back
AuditChart coverageCheck: no footprint overlaps
PublishStatic hostingCheck: the pointer switches last
The stages from this talk, in order.
Built with AI coding agents. The checks decide what ships.
That’s the whole pipeline: ingest NOAA’s charts, extract the features, tile them into one PMTiles file, audit the coverage, and publish. I built it with AI coding agents. The check at each stage is what makes that safe.
Ivan Storck · CharTiles
I build AI-assisted data pipelines for maps, charts, and media, with a check at every stage.
That’s the work I do now: data pipelines for maps, charts, and media, built with AI agents and checked at every stage. If you have a map, chart, or dataset that’s stuck, email me and tell me what you want it to do.